Running XPath Performance Test
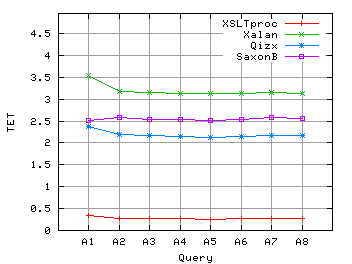
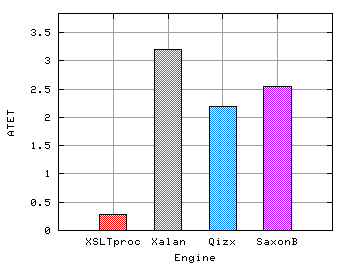
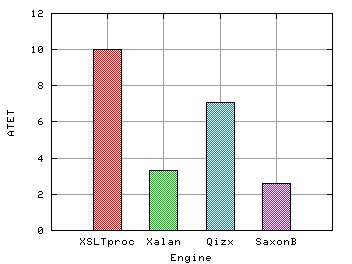
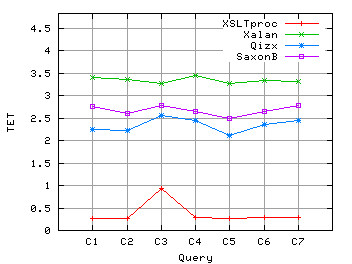
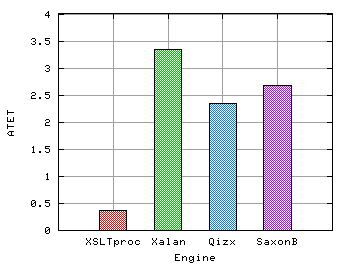
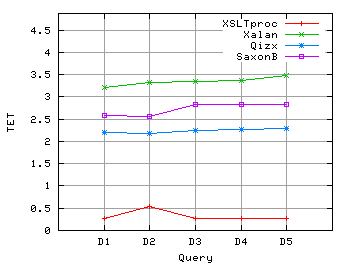
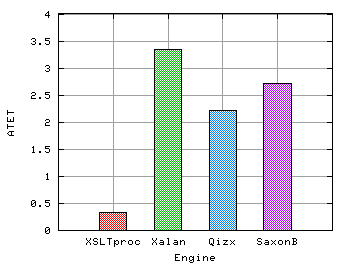
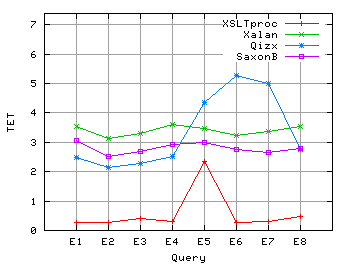
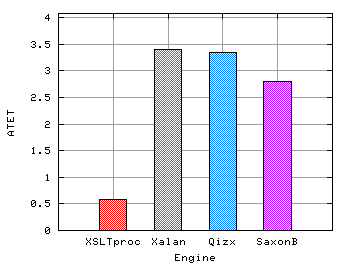
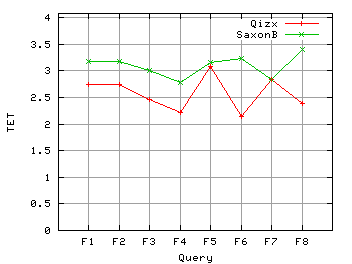
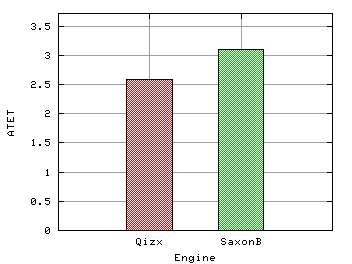
We report about our outcomes for XPath Performance Test. As a first test, we ran the entire test over an XMark document of about 2 MB (scaling factor 0.02). The following two-column plot gallery illustrates the results we got: each row refers to a different query group. For each query group, the left column plots the total evaluation time (TET) for each query in the group while the right one depicts the average total evaluation time (ATET) for the group. The total evaluation time for an engine, a document, and a query is the time taken by the engine to evaluate the query including all the evaluation steps from document parsing to result serialization. All times are CPU times in seconds. Notice that some scales are logarithmic (when the difference between times is high). Moreover, queries in XPath-F have been tested with respect to their XQuery version (hence only on XQuery processors SaxonB and Qizx).
 |
 |
 |
 |
 |
 |
 |
 |
 |
 |
 |
 |
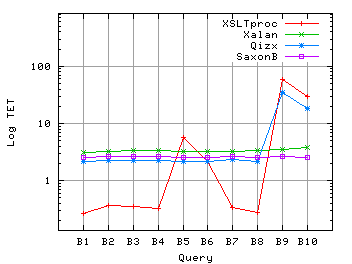
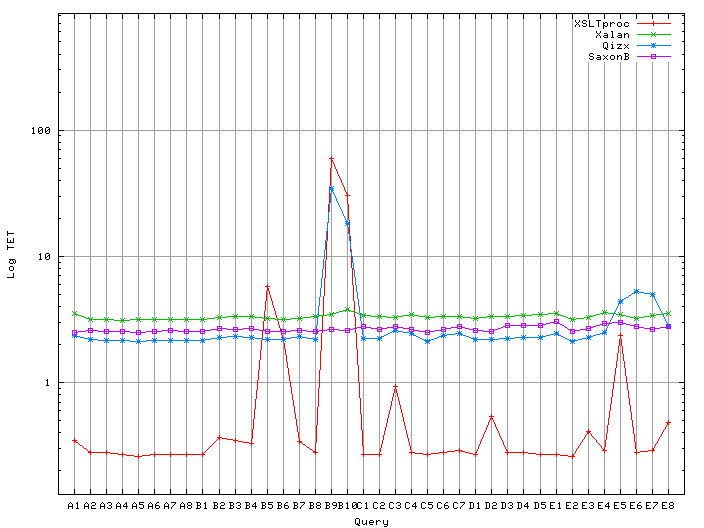
The following plot shows the evaluation times for all the queries of the benchmark (excluding those belonging to XPath-F):
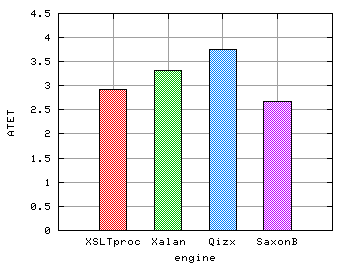
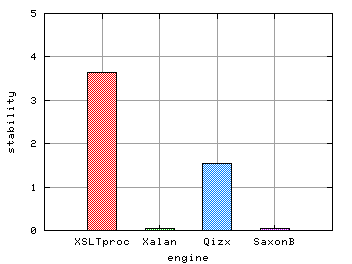
Next, on the left, we show the average total evaluation time for the entire benchmark (excluding XPath-F) and, on the right, the stability measure, which is the ratio between the standard deviation and the mean of the query evaluation times:
 |
 |
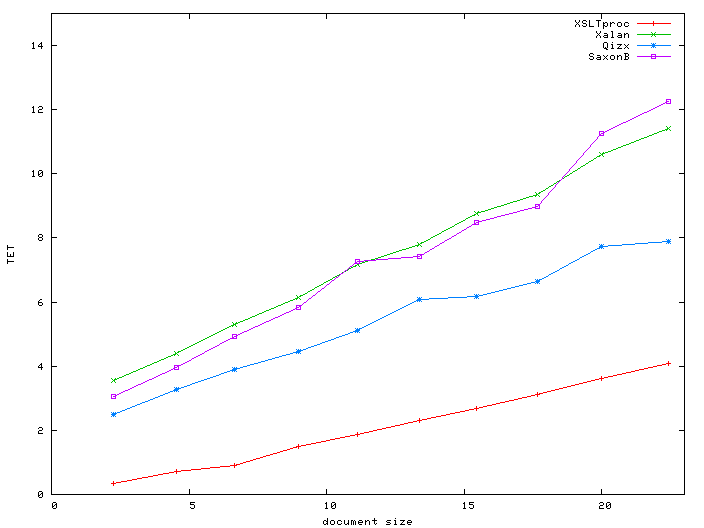
We are now interested in measuring the scalability of the engines. Data scalability is the performance of the processor as the data complexity (document size) grows. As an example, we tested data scalability for query E1 on the following document size (in MB) sequence (2.24, 4.54, 6.64, 8.99, 11.13, 13.37, 15.46, 17.67, 19.97, 22.43) corresponding to the following document scaling factor sequence (0.02, 0.04, 0.06, 0.08, 0.10, 0.12, 0.14, 0.16, 0.18, 0.20):
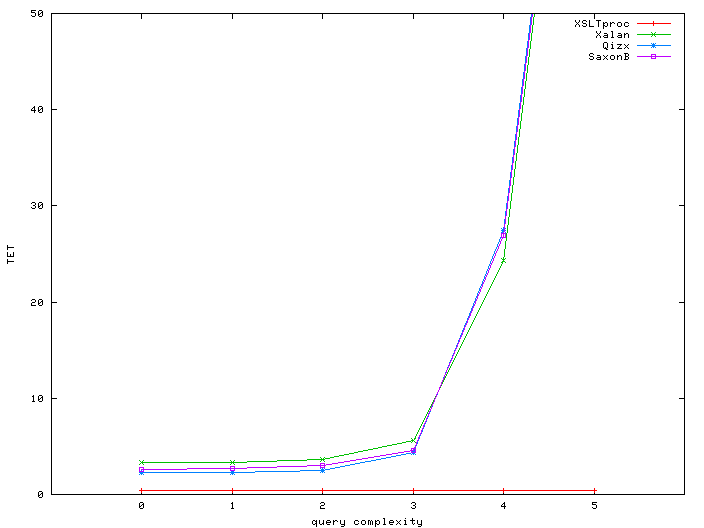
Query scalability is the performance of the processor as the query complexity grows. As an example, we tested query scalability for an XMark document of 2 MB (scaling factor 0.02) on queries B13(i), for i = 0,1,...5: