Science and social science citation map (generated with Mapequation.org)
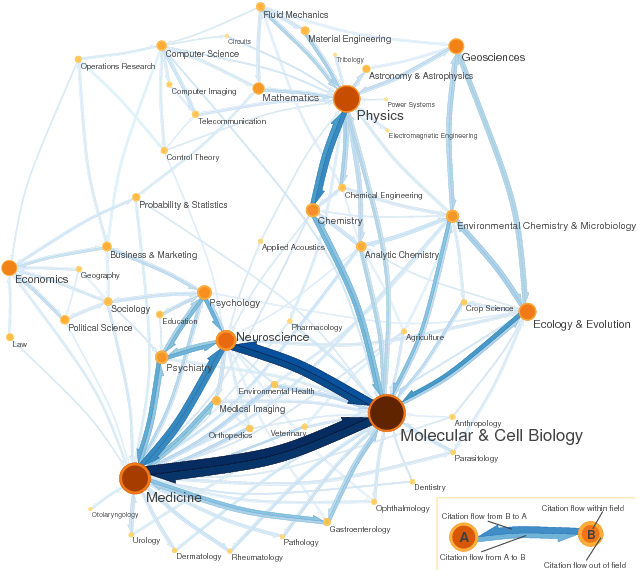
Bibliometrics, also known as scientometrics, is the quantitative study of the process of scholarly publication of research achievements. The complex system of scholarly publication reveals different types of networks, mainly citation networks (where links represent bibliographic references) and collaboration networks (in which links correspond to article co-authorships). These networks are analysed in order to capture meaningful properties of the underlying research system, and in particular to determine the influence of bibliometric units like scholars and journals.
Science and social science citation map (generated with Mapequation.org)
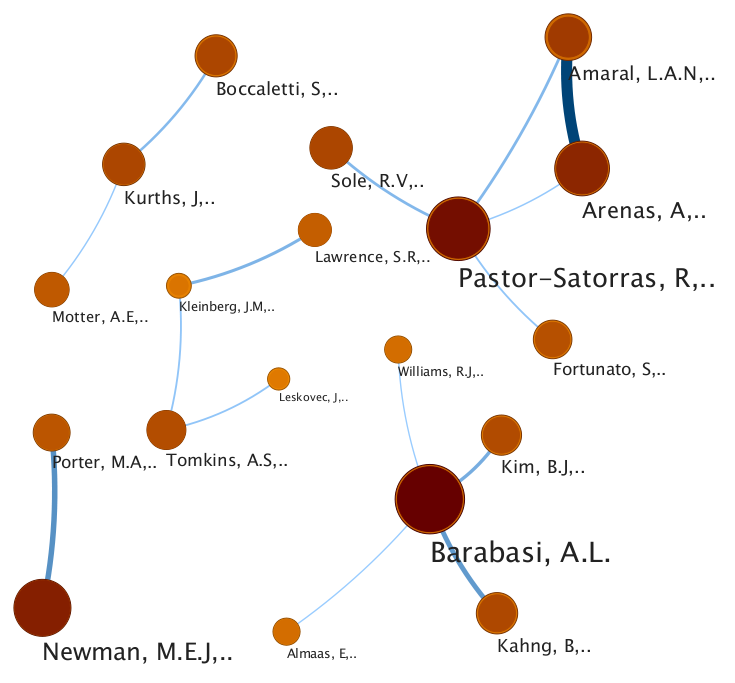
Collaboration map for the field of network science (generated with Mapequation.org)
A central question is: why bibliometric analysis of research performance? Peer review, that is, the evaluation made by expert peers, undoubtedly is an important procedure of quality judgment. But peer review and related expert-based judgments may have serious shortcomings. Subjectivity, i.e., dependence of the outcomes on the choice of individual reviewers, is one of the major problems. Moreover, peer review is slow and expensive (at least in terms of hours of volunteer work devoted to refereeing). In particular, peer review methodology is practically unfeasible when the number of units to evaluate is consistent, e.g., all papers published by all members of a large research structure.
Bibliometric assessment of research performance is based on the following central assumptions:
Assuming these hypothesis, citations can be used as an indicator of the impact of an academic publication. Some words of caution are needed:
Bibliometric analysis can be conducted on the bases of any sufficiently large bibliographic database enhanced with citation counts. A bibliometric data source may be evaluated according to the following criteria:
In particular, coverage is of crucial importance since it influences the outcomes of the computation for bibliometric indicators. An uneven coverage may produce performance measures that are too far from the real figures and this may lead to wrong decisions. Some aspects directly connected to database coverage are:
The bibliometric databases of the Institute for Scientific Information (ISI) have been the most generally used data sources for bibliometric analysis. The ISI was founded by Eugene Garfield in 1960 and acquired by Thomson (today Thomson-Reuters) in 1992. It provides access to many resources, in particular:
Two major alternatives to Web of Science are Elsevier's Scopus and Google Scholar. Scopus, as Web of Science, is a subscription-based proprietary database that contains mainly journal bibliometric information. The coverage of Web of Science and Scopus is comparable. On the contrary, Google Scholar is freely accessible and indexes more types of works, including journal articles, conference papers, books, theses, and reports.
Traditional bibliometric indexes used to evaluate the research performance of individual scholars include production measures (number of published papers, possibly divided by the academic age) and impact measures (number of received citations, possibly divided by the academic age or by the number of publications).
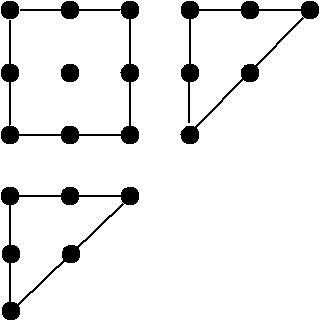
A more interesting measure is the h index:The h index of a scholar is the highest number $n$ of papers a scholar has that have each received at least $n$ citations.
For instance, my current h index computed with Google Scholar is 14, meaning that I am the author of 14 papers each of them cited at least 14 times. The rest of my papers are all cited a number of times that is less than or equal to 14.
The h index as the size of the Durfee square in Ferrers diagram
The index was proposed by Jorge E. Hirsch, a physicist, in 2005 and it has immediately found interest in the public and in the bibliometrics literature. Anecdotally, an earlier metric of the same form is Eddington number, devised by Sir Arthur Stanley Eddington, a British astrophysicist, in the context of cycling; it is defined as E, the number of days a cyclist has cycled more than E miles.
The index has the following features:
Hirsch suggests that a value of h equal to the scholar academic age characterizes a successful scientist, and a value two times the academic age characterizes outstanding scientists.
The h index has also been criticized. The following are acknowledged limitations of the index:Leo Egghe proposes the g index to increase the beauty of small but highly-cited paper sets:
The g index of a scholar is the highest number $n$ of papers a scholar has that received together at least $n^2$ citations.
For instance, my current g index computed with Google Scholar is 21, meaning that my top-cited 21 publications collected in total at least 441 citations.
The h index is currently computed by both Web of Science and Scopus. Anne-Wil Harzing's Publish or Perish computes (on Windows systems) the h and g indices using Google Scholar as a data source, while Pagella does the same in the platform-independent Java language.
The traditional bibliometric indicator fro journals is the Impact Factor. Roughly, the Impact Factor of a journal is the average number of recent citations received by articles published in the journal. More precisely, the Impact Factor of a journal for a specific census year is the mean number of citations that occurred in the census year to the articles published in the journal during a target window consisting of the two previous years.
Such a measure was devised by Garfield, the founder of the Institute for Scientific Information (ISI). Today, Thomson-Reuters, that acquired the ISI in 1992, computes the the Impact Factor for journals it tracks and publishes it annually in the Journal Citation Reports (JCR).
The Impact Factor has its own merits and faults. The strengths of the Impact Factor are comprehensibility, simplicity, robustness, wide and fast availability. On the other hand, frequently mentioned flaws of the Impact Factor are that the target window of two years is too short, it does not represent a typical value since it is a mean of a highly skewed distribution, it does not consider the status of the citing journals, and it widely differs from one discipline to another.
Citation distributions are typically right skewed: most of the papers of a journal receive few citations, while few papers harvest the big deal of citations. Since the Impact Factor is a mean value of a skewed distribution, it does not represent the citation score of a characteristic paper. Hence, it is misleading to predict the importance of an individual publication, and hence of an individual researcher, based on the Impact Factor of the publication's journal. Indeed, most papers published in a high Impact Factor journal will ultimately be cited many fewer times than the Impact Factor may seem to suggest.
The Impact Factor equally weights all citations: citations from highly reputed journals, like Nature, Science, and Proceedings of the National Academy of Sciences of USA, are treated as citations from obscure publication sources. The Eigenfactor is a PageRank-inspired metric that weights journal citations by the influence of the citing journals. As a result, a journal is influent if it is cited by other influent journals.
In the following, we illustrate the Eigenfactor method. The Eigenfactor computation uses a census citation window of one year and an earlier target publication window of five years. Let us fix a census year and let $C = (c_{i,j})$ be a journal-journal citation matrix such that $c_{i,j}$ is the number of citations from articles published in journal $i$ in the census year to articles published in journal $j$ during the target window consisting of the five previous years. Journal self-citations are ignored, hence $c_{i,i} = 0$ for all $i$. Moreover, let $a$ be an article vector such that $a_i$ is the number of articles published by journal $i$ over the five-year target window divided by the total number of articles published by all journals over the same period.
A dangling journal $i$ is a journal that does not cite any other journals; hence, if $i$ is dangling, the $i$th row of the citation matrix has all 0 entries. The citation matrix $C$ is transformed into a normalized matrix $H = (h_{i,j})$ such that all rows that are not dangling nodes are normalized by the row sum. Furthermore, $H$ is mapped to a matrix $S$ in which all rows corresponding to dangling nodes are replaced with the article vector $a$ (which corresponds to the bookmark vector in the PageRank method).
A new matrix $G$ is defined as follows:
$\displaystyle{G = \alpha S + (1- \alpha) T}$
where $T$ is the teleportation matrix with identical rows each equal to the article vector $a$, and $\alpha$ is a parameter of the algorithm, usually set to $0.85$.
Let $\pi$ be the left eigenvector of $G$ associated with the unity eigenvalue, that is, the vector $\pi$ such that $\pi = \pi G$. The vector $\pi$, called the influence vector, contains the scores used to weight citations allocated in matrix $H$. Finally, the Eigenfactor vector $\eta$ is computed as:
$\displaystyle{\eta = \pi H$
That is, the Eigenfactor score of a journal is the sum of normalized citations received from other journals weighted by the Eigenfactor scores of the citing journals.
The Eigenfactor has an intuitive interpretation in terms of random walks on the citation network. Imagine a researcher that moves from journal to journal by following chains of citations. The researcher selects a journal article at random and reads it. Then, he retrieves at random one of the citations in the article and proceeds to the cited journal. Hence, the researcher chooses at random an article from the reached journal and goes on like this. Eventually, the researcher gets bored of following citations, and selects a random journal in proportion to the number of article published by each journal. With this model of research, the influence weight of a journal corresponds to the relative frequency with which the random researcher visits the journal.
The Eigenfactor score is a size-dependent measure of the total influence of a journal, rather than a measure of influence per article, like the Impact Factor. To make the Eigenfactor scores size-independent and comparable to Impact Factors, we need to divide the journal influence by the number of articles published in the journal. This measure is called Article Influence.
The Eigenfactor method was initially developed by Jevin West, Ben Althouse, Martin Rosvall, and Carl Bergstrom at the University of Washington and Ted Bergstrom at the University of California Santa Barbara. Eigenfactor and Article Influence scores are freely accessible at the Eigenfactor web site and, from 2007, they have been included into Thomson-Reuters Journal Citation Reports.