[home]
A QuickTime movie (700K) showing an approximation to Peano's continuous, square-filling curve.
A continuous but not differentiable function
of two variables: ![]()
|
|
<- click & drag this picture!. This was done with Mathematica and the free LiveGraphics3D Java applet.
|
A text written on a Moebius strip:
See also other related files.
An animation, intended to illustrate Euler's famous formula combining the numbers e, pi, i, 1, 0. Also, a flash version, if you can display it.
For viewing the following interactive pictures you will need the free Wolfram CDF Player plugin:
Until the late 19th century, mathematicians did not suspect that the concept of "area of a curved surface" could be quite very complicated to define precisely. In 1868 J.A. Serret for example made a naive description of how to approximate the area of a curved surface with the areas of finer and finer triangulations.
Actually, Serret's approach was wrong, as Hermann Amandus Schwarz in 1881 showed with a two-page article: even a surface as simple as a cilynder could be triangulated in such a way as to make the total area of the triangles as large as desired. Here above you can see two triangulations made according to Schwarz's recipe. From their look, objects like these are variously known as Schwarz's accordion, or pineapple, or boot, or lantern.
A 3D graphic version of the Moebius strip.
The following is a graph of an a period of the sound wave of a piano chord, seen as a function on the circle. See here for more information.
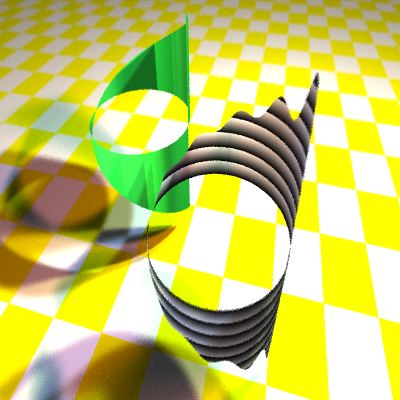
The following picture is a result of playing around with POV-ray. It shows a toothsaw wave (green) and its approximation by a truncated Fourier series (black & white), seen as functions on the unit circle, not as periodic functions of time. The raw objects were calculated with Mathematica, rendered (after some editing) with POV-ray, and JPEG-compressed with GraphicConverter.
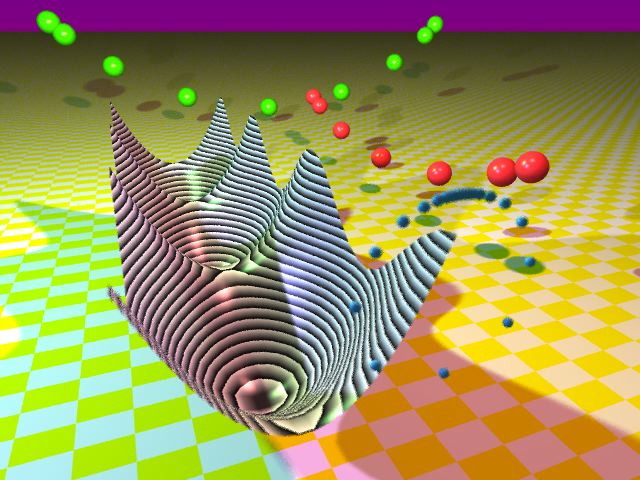
Here is a surface graph of the energy of the simple pendulum as a function of the angle and of the angular velocity, with the level sets highlighted. The green, red and blue balls are stroboscopic images of pendulums with different amplitudes (a whole circle for the blue ball). The radius is not shown The mathematical description of the objects was done with Mathematica and the rendering with POV-ray.