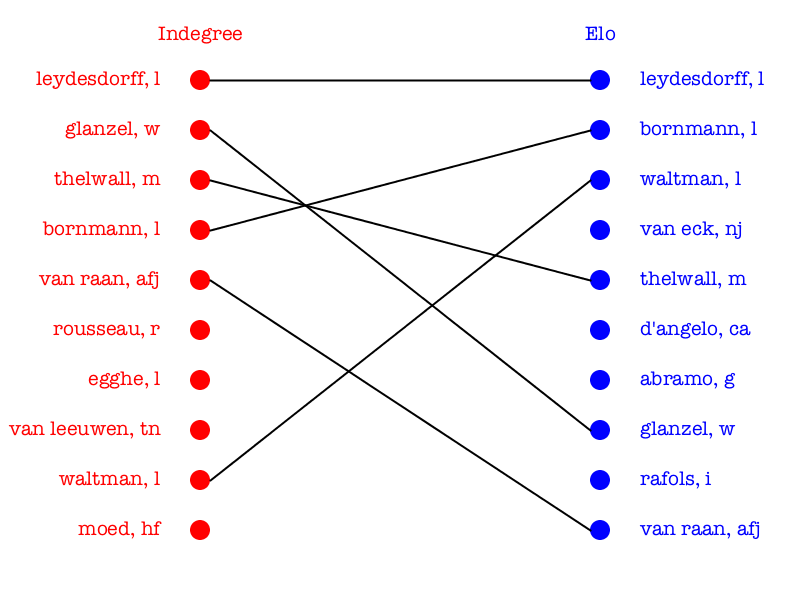
In this part we will learn to visually compare the top parts of two rankings (code). The idea is to consider the top-$k$ positions of two rankings and draw them as a bipartite graph: node types corresponds to the two rankings, nodes are the actors of the rankings and edges link the same node in the two rankings, if it is present in both compilations. This visualization gives an immediate idea of the rank switchings of actors in the two rankings and hence of correlation between the two variables: the more edges in the graph, and in particular the more the edges are horizontal, the higher the correlation between the two rankings. An example comparing the top-10 bibliometrics scholars ranked with indegree and Elo methods is the following: