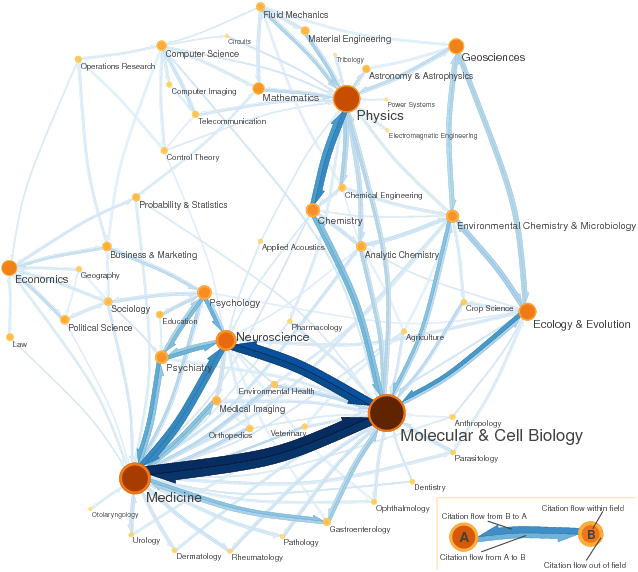
Science and social science citation map (generated with Mapequation.org)
Bibliometrics is a field of information and library science devoted to the quantitative study of the process of scholarly publication of research achievements.
The complex system of scholarly publication reveals different types of networks, mainly citation networks (where links represent bibliographic references) and collaboration networks (in which links correspond to co-authorships in publications).
These networks are analysed in order to capture meaningful properties of the underlying research system, and in particular to determine the influence of bibliometric units like scholars and journals.
Science and social science citation map (generated with Mapequation.org)
Bibliometric assessment of research performance is based on the following central assumptions:
Assuming these hypothesis, citations can be used as an indicator of the impact of an academic publication. Some words of caution are needed:
Traditional bibliometric indexes used to evaluate the research performance of individual scholars include production measures (number of published papers, possibly divided by the academic age) and impact measures (number of received citations, possibly divided by the academic age or by the number of publications).
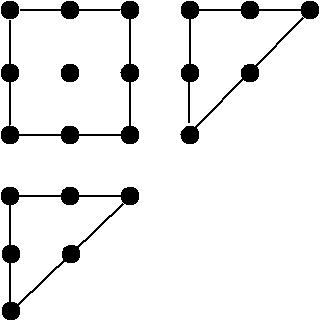
A more interesting measure is the h index:The h index of a scholar is the highest number $n$ of papers a scholar has that have each received at least $n$ citations.
The h index as the size of the Durfee square in Ferrers diagram
The index was proposed by Jorge E. Hirsch, a physicist, in 2005 and it has immediately found interest both in the public and in the bibliometrics literature.
The index has the following features:
Hirsch suggests that a value of the index equal to the scholar academic age characterizes a successful scientist, and a value two times the academic age characterizes outstanding scientists.
The h index has also been criticized. The following are acknowledged limitations of the index:
Many variants of the h index have been proposed to overcome these limitations. No one has become popular as the original h index.
The traditional bibliometric indicator for journals is the Impact Factor:
The Impact Factor of a journal for a specific year is the mean number of citations that occurred in that year to the articles published in the journal during the two previous years.
The Impact Factor has its own merits:
Frequently mentioned flaws of the Impact Factor are:
Citation distributions are severely right skewed, meaning that most papers are poorly cited and a few hubs collect the majority of citations.
The Lorenz curve for conference (dashed) and journal (solid) citations in computer science.
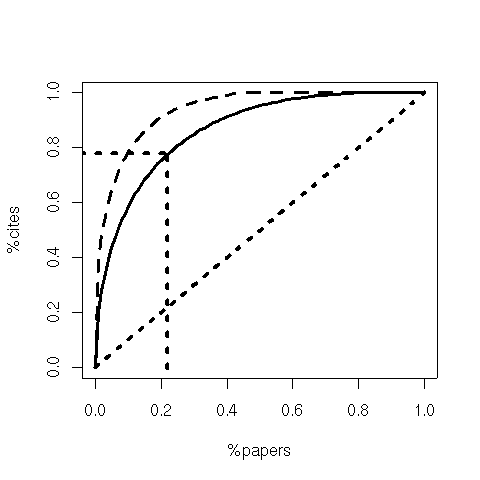
It is hence misleading to predict the importance of an individual publication, or of an individual researcher, based on the Impact Factor of the publication's journal. Indeed, most papers published in a journal will ultimately be cited much less than the journal Impact Factor.
The Impact Factor equally weights all citations: citations from highly reputed journals are treated as citations from obscure publication sources. The Eigenfactor is a PageRank-inspired metric that weights journal citations by the influence of the citing journals. The Eigenfactor thesis reads:
A journal is influent if it is cited by other influent journals.
Let $C = (c_{i,j})$ be a journal-journal citation matrix such that $c_{i,j}$ is the number of citations from articles published in journal $i$ in a given year to articles published in journal $j$ during the five previous years.
Moreover, let $a$ be an article vector such that $a_i$ is the relative frequency of articles published by journal $i$ over the five-year window. Let $T$ be the teleportation matrix with identical rows each equal to the article vector $a$.
A dangling journal $i$ is a journal that does not cite any other journals; hence, if $i$ is dangling, the $i$th row of the citation matrix has all 0 entries.
The citation matrix $C$ is transformed into a normalized matrix $S$ such that:
Finally, the Eigenfactor matrix $G$ is defined as follows:
$\displaystyle{G = \alpha S + (1- \alpha) T}$
where $\alpha$ is a parameter of the algorithm (the damping factor), usually set to $0.85$.
The Eigenfactor vector $\pi$ be the left eigenvector of $G$ associated with the unity eigenvalue, that is, the vector $\pi$ such that:
$\displaystyle{ \begin{array}{lcl} \pi & = & \pi G \\ \pi_j & = & \sum_{i} \pi_i g_{i,j} \end{array}}
The Eigenfactor score $\pi_j$ of journal $j$ is the sum of normalized citations received from other journals weighted by the Eigenfactor scores of the citing journals.
Notice that both matrices $S$ and $T$ are row-stochastic. It follows that $G$ is stochastic as well. Thanks to the teleportation trick, moreover, the graph of matrix $G$ is strongly connected, and hence $G$ is irreducible. Using Perron-Frobenius theorem, a positive Eigenfactor vector exists and is unique. The solution can be efficiently computed with the power method.
Interestingly, we can arrive at the same result using Markov theory. The stochastic matrix $G$ can be viewed as the transition matrix of a finite-state Markov chain. Since $G$ is irreducible, the chain has a unique stationary distribution corresponding to the Eigenfactor vector.
Bibliometric analysis can be conducted on the bases of any sufficiently large bibliographic database enhanced with citation counts.
The bibliometric databases of the Institute for Scientific Information (ISI) have been the most generally used data sources for bibliometric analysis. The ISI was founded by Eugene Garfield in 1960 and acquired by Thomson (today Thomson-Reuters) in 1992. It provides access to many resources, in particular:
Two major alternatives to Web of Science are Elsevier's Scopus and Google Scholar.
Elsevier's Scopus, as Web of Science, is a subscription-based proprietary database that contains mainly journal bibliometric information. The coverage of Web of Science and that of Scopus are comparable.
Google Scholar is freely accessible and indexes more types of works, including journal articles, conference papers, books, theses, and reports. Anne-Wil Harzing's Publish or Perish computes bibliometric indicators using Google Scholar as a data source.
The application of bibliometrics in some fields is hindered by a technical problem: the coverage of the data sources for these fields. Both Web of Science and Scopus mainly index journal publications in English. The coverage of Web of Science with respect to fields of science widely differs; for instance, the internal coverage of molecular and cell biology is 80%, that of mathematics is 55%, and that of computer science is 27%.
Social sciences are generally more scarcely covered than sciences. Arts and humanities scholars mainly publish monographes, often not in English, and hence the use of Web of Science for them is largely inadequate. Since the coverage of Scopus is substantially that of Web of Science, the same considerations hold for Scopus as well.
Clearly, bibliometric scores computed on a data source that covers only a small fraction of the discipline literature are completely misleading. Substantially, we agree with Michel Zitt when he claims that
If scientometrics is a mirror of science in action, then scientometricians' particular responsibility is to both polish the mirror and warn against optical illusions.
Academic collaboration is fundamental in many research fields. In particular, co-authorship in publications is widely considered as a reliable proxy for scientific collaboration.
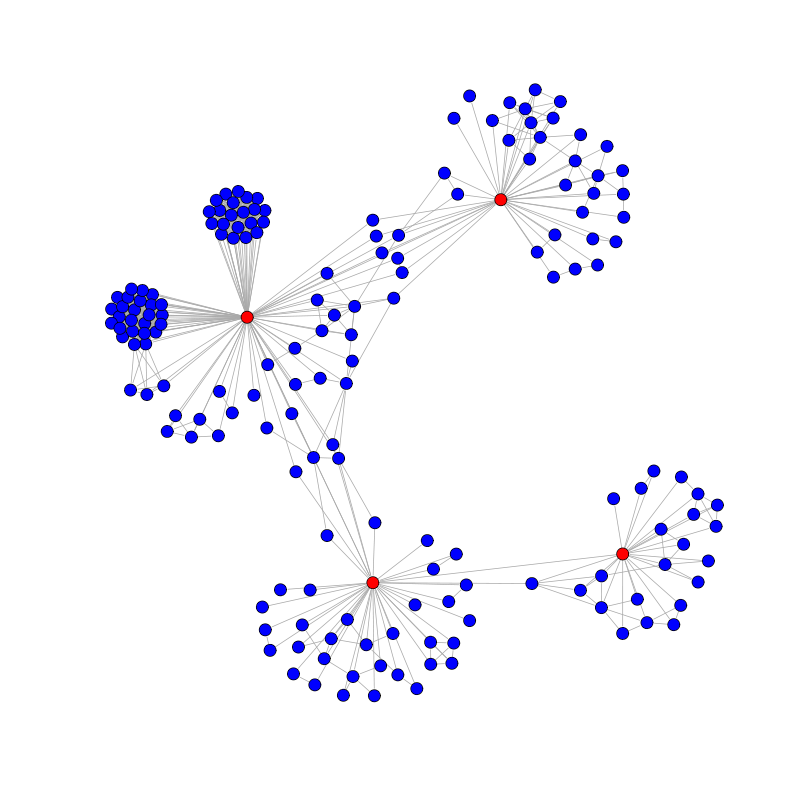
Co-authorship can be interpreted as a social relationship between authors. Collaboration networks are instances of social networks in which individual scholars play the role of nodes and two scholars are connected by an undirected edge if they have written a paper together.
A small collaboration graph for all publications of four computer scientists (red nodes).
The notion of academic collaboration network first appeared in 1969 in a brief note by mathematician Casper Goffman, who defined the Erdős number for a given mathematician as the length of the shortest path on the mathematics collaboration network connecting the mathematician with Paul Erdős.
The idea of Erdős number and hence of collaboration network, however, was informally already present in the mathematics community before 1969, since in Goffman's note we can read:
I was told several years ago that my Erdős number was 7. It has recently been lowered to 3. Last year I saw Erdős in London and was surprised to learn that he did not know that the function v(Erdős; .) was being considered. When I told him the good news that my Erdős number had just been lowered, he expressed regret that he had to leave London the same day. Otherwise, an ultimate lowering might have been accomplished.
We studied the whole computer science collaboration network as recorded in The DBLP Computer Science Bibliography (DBLP). The network consists of 688,642 nodes and 2,283,764 collaboration edges. Specifically, we investigated:
Having a large connected component in the collaboration graph, of the order of the number of scholars, is a desirable property for a discipline that signals its maturity: theories and experimental results can reach, via collaboration chains, the great majority of the scholars working in the field.
Thus scholars are scientifically well-informed and can incrementally build new theories and discover new results on top of established knowledge.
The computer science collaboration network is widely connected. The largest connected component counts 583,264 scholars, that is 85% of the entire network. The largest biconnected component counts 418,001 nodes, or 61% of the entire network, and it covers a share of 72% of the largest connected component.
Mark Newman studied the mathematics collaboration network compiled from MatSciNet, the database maintained by the journal Mathematical Reviews (253,339 nodes and 496,489 edges). He found that the largest connected component covers 82% of the whole network.
Connectedness, however, does not tell us the whole story, since it says nothing about how fast information flows. Information flows faster along shorter paths. In this respect, there exists a substantial difference if the average path connecting two scholars has length, say, six edges, or one hundred links.
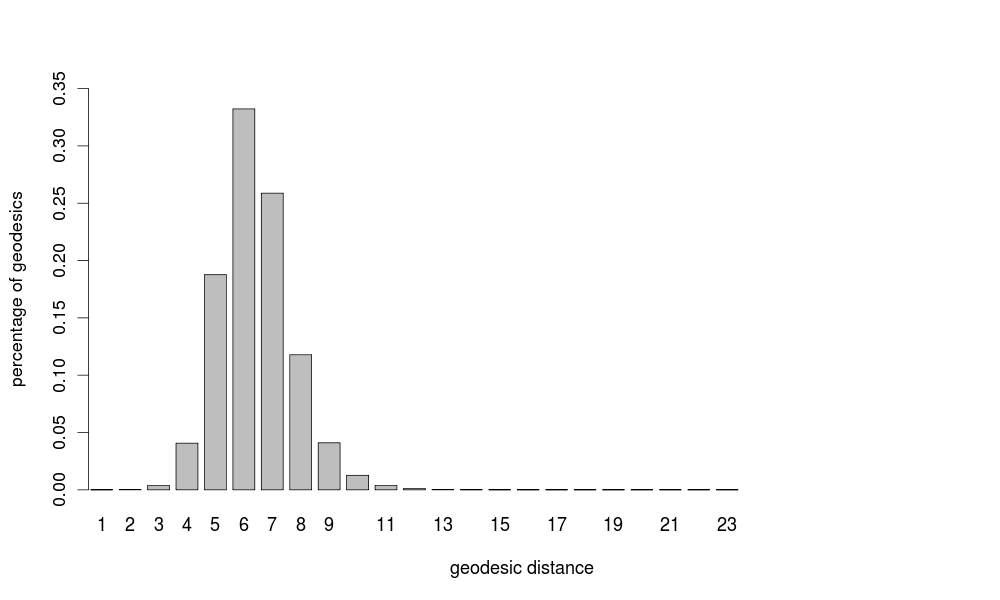
We may assume that information preferentially flows along geodesics, which are shortest paths, in terms of number of edges, in the collaboration graph. The geodesic distance between two nodes is the length (number of edges) of any geodesic connecting the nodes. The average geodesic distance is the mean geodesic distance among all pairs of connected nodes of the graph. The largest geodesic distance is called the diameter of the network.
The average geodesic distance in computer science is 6.41. The diameter is 23. Hence, computer scientists are separated on average by 6 collaboration links, a figure that matches well the legendary six degrees of separation found by the experimental psychologist Stanley Milgram in the 1960s with his popular small-world experiment.
The distances in mathematics are larger: the average geodesic distance is 7.57 and the diameter is 27. This means that collaborations in mathematics are less frequent and less effective. This is also evident from two other large-scale network properties: